
Mobile Testing: Getting Started with Android DDMS
 Debugging is the phase in software development that comes after the testing phase in the software, and a after a bug has been discovered. It requires searching and correcting the bug on that software; which in many cases finding it usually takes more time than fixing it. That is why testers should also perform debugging to the apps that they are validating.
In this post we will be running the Android Logcat provided in the DDMS (Dalvik Debug Monitor Server) within the Android SDK. For that we should first enable the Debug Mode on our Android device. In order to do that go to:
Settings -> Developer Options -> Check USB debuggingNow, we need to open Eclipse from our Android SDK and select the DDMS in the upper right corner.
DDMS works with both the emulator and a connected device. If both are connected and running simultaneously, DDMS defaults to the emulator. It will allow us to diagnose the apps functioning and it filters all logs according to importance.
Devices tab shows the processes running on the device. That includes:
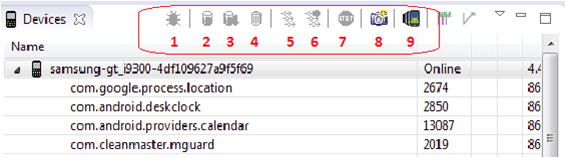
1. Debug Process: Displays the state of connection.
2. Update Heap: Heap information gets enabled.
3. Dump HPROF: Creates a Heap dump.
4. Cause GC: Garbage collector starts heap data.
5. Update thread: Displays the information from the running thread.
6. Start Method Profiling: Collects information about amount of time taken to execute a method, number of calls.
7. Stop Process: Stops the selected process.
8. Screen Capture: Takes a screenshot of what’s been displayed on the device.
9. Reset ADB: ADB gets restarted.
In the other window we can find several options
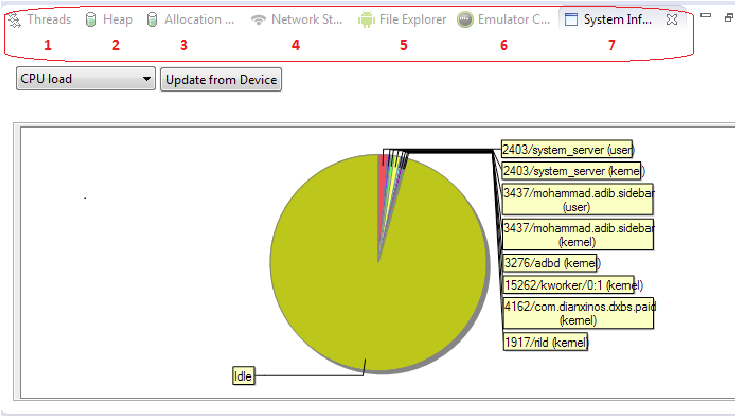
1. Threads tab displays information related to the thread for each process selected in the devices view.
2. Heap tab displays information and statistics about memory heap.
3. Allocation Tracker tab displays in real time information about allocation happening in the application over a certain period of time.
4. Network Statistics tab displays the amount of network data an app is using.
5. Emulator Control tab allows to emulate real conditions of using on the device.
6. File Explorer tab displays the directories and file structure of the device.
7. System Information tab displays information about the CPU and GPU load.
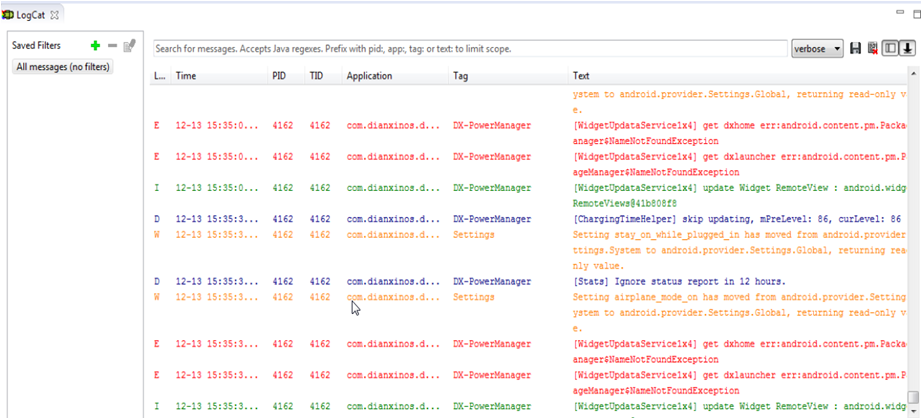
Logcat tab provides a mechanism for collecting and viewing system debug output. Logs from various applications and portions of the system are collected in a series of circular buffers.
How DDMS Interacts with a Debugger
On Android, every application runs in its own process, each of which runs in its own virtual machine (VM). Each VM exposes a unique port that a debugger can attach to.
When DDMS starts, it connects to adb. When a device is connected, a VM monitoring service is created between adb and DDMS, which notifies DDMS when a VM on the device is started or terminated. Once a VM is running, DDMS retrieves the VM's process ID (pid), via adb, and opens a connection to the VM's debugger, through the adb daemon (adbd) on the device. DDMS can now talk to the VM using a custom wire protocol.
About the Author
Mario Moreno holds a Bachelor in System Engineering with more than 3 years of experience in software testing. He currently works at iTexico as a QA Engineer.


Post Your Comment Here